Fulbrix vs The Mason
Fulbrix has 49 available apartments from $2,529 (median $3,182). The Mason has 25 available apartments from $2,611 (median $3,075). Prices, sizes, amenities, transit and reviews side by side, checked September 23, 2026.

Where they differ
- Fulbrix starts lower, at $2,529 a month against $2,611 at The Mason.
- For a studio, the median asking rent is $2,534 at Fulbrix and $2,611 at The Mason, a difference of $77 (3%).
- For a 1 bedroom, the median asking rent is $3,066 at The Mason and $3,136 at Fulbrix, a difference of $70 (2%).
- For a 2 bedroom, the median asking rent is $4,439 at The Mason and $4,922 at Fulbrix, a difference of $483 (10%).
- For a 3 bedroom, the median asking rent is $5,575 at The Mason and $5,732 at Fulbrix, a difference of $157 (3%).
- Per square foot, The Mason is the better value at $4.04 against $4.34 at Fulbrix.
- Fulbrix has more choice right now: 49 available apartments against 25 at The Mason.
- Renters rate The Mason higher on Google: 4.7 out of 5 against 4.5 for Fulbrix.
- Only Fulbrix lists rooftop, pets allowed.
- The Mason is closer to the CTA: Ashland (Green/Pink) is a 7 minute walk, while Fulbrix is 9 minutes from Morgan.
- Fulbrix is running a special: 1 MO FREE.
Rent and availability
| Fulbrix | The Mason | |
|---|---|---|
| Available now | 49 | 25 |
| Starting rent | $2,529 | $2,611 |
| Median asking rent | $3,182 | $3,075 |
| Median rent per sq ft | $4.34 | $4.04 |
| Studio | from $2,529 · median $2,534 · 3 available · ~544 sq ft | from $2,611 · median $2,611 · 1 available · ~517 sq ft |
| 1 bedroom | from $2,753 · median $3,136 · 37 available · ~742 sq ft | from $2,745 · median $3,066 · 15 available · ~744 sq ft |
| 2 bedroom | from $4,276 · median $4,922 · 5 available · ~1,069 sq ft | from $4,095 · median $4,439 · 5 available · ~1,155 sq ft |
| 3 bedroom | from $5,488 · median $5,732 · 4 available · ~1,296 sq ft | from $5,150 · median $5,575 · 2 available · ~1,300 sq ft |
| Current specials | 1 MO FREE | None listed |
Building and amenities
| Fulbrix | The Mason | |
|---|---|---|
| Neighborhood | Fulton Market | Fulton Market |
| Year built | n/a | n/a |
| Total units | 49 | 25 |
| Google rating | 4.5 / 5 (66 reviews) | 4.7 / 5 (196 reviews) |
| In-unit laundry | Yes | Yes |
| Pool | Yes | Yes |
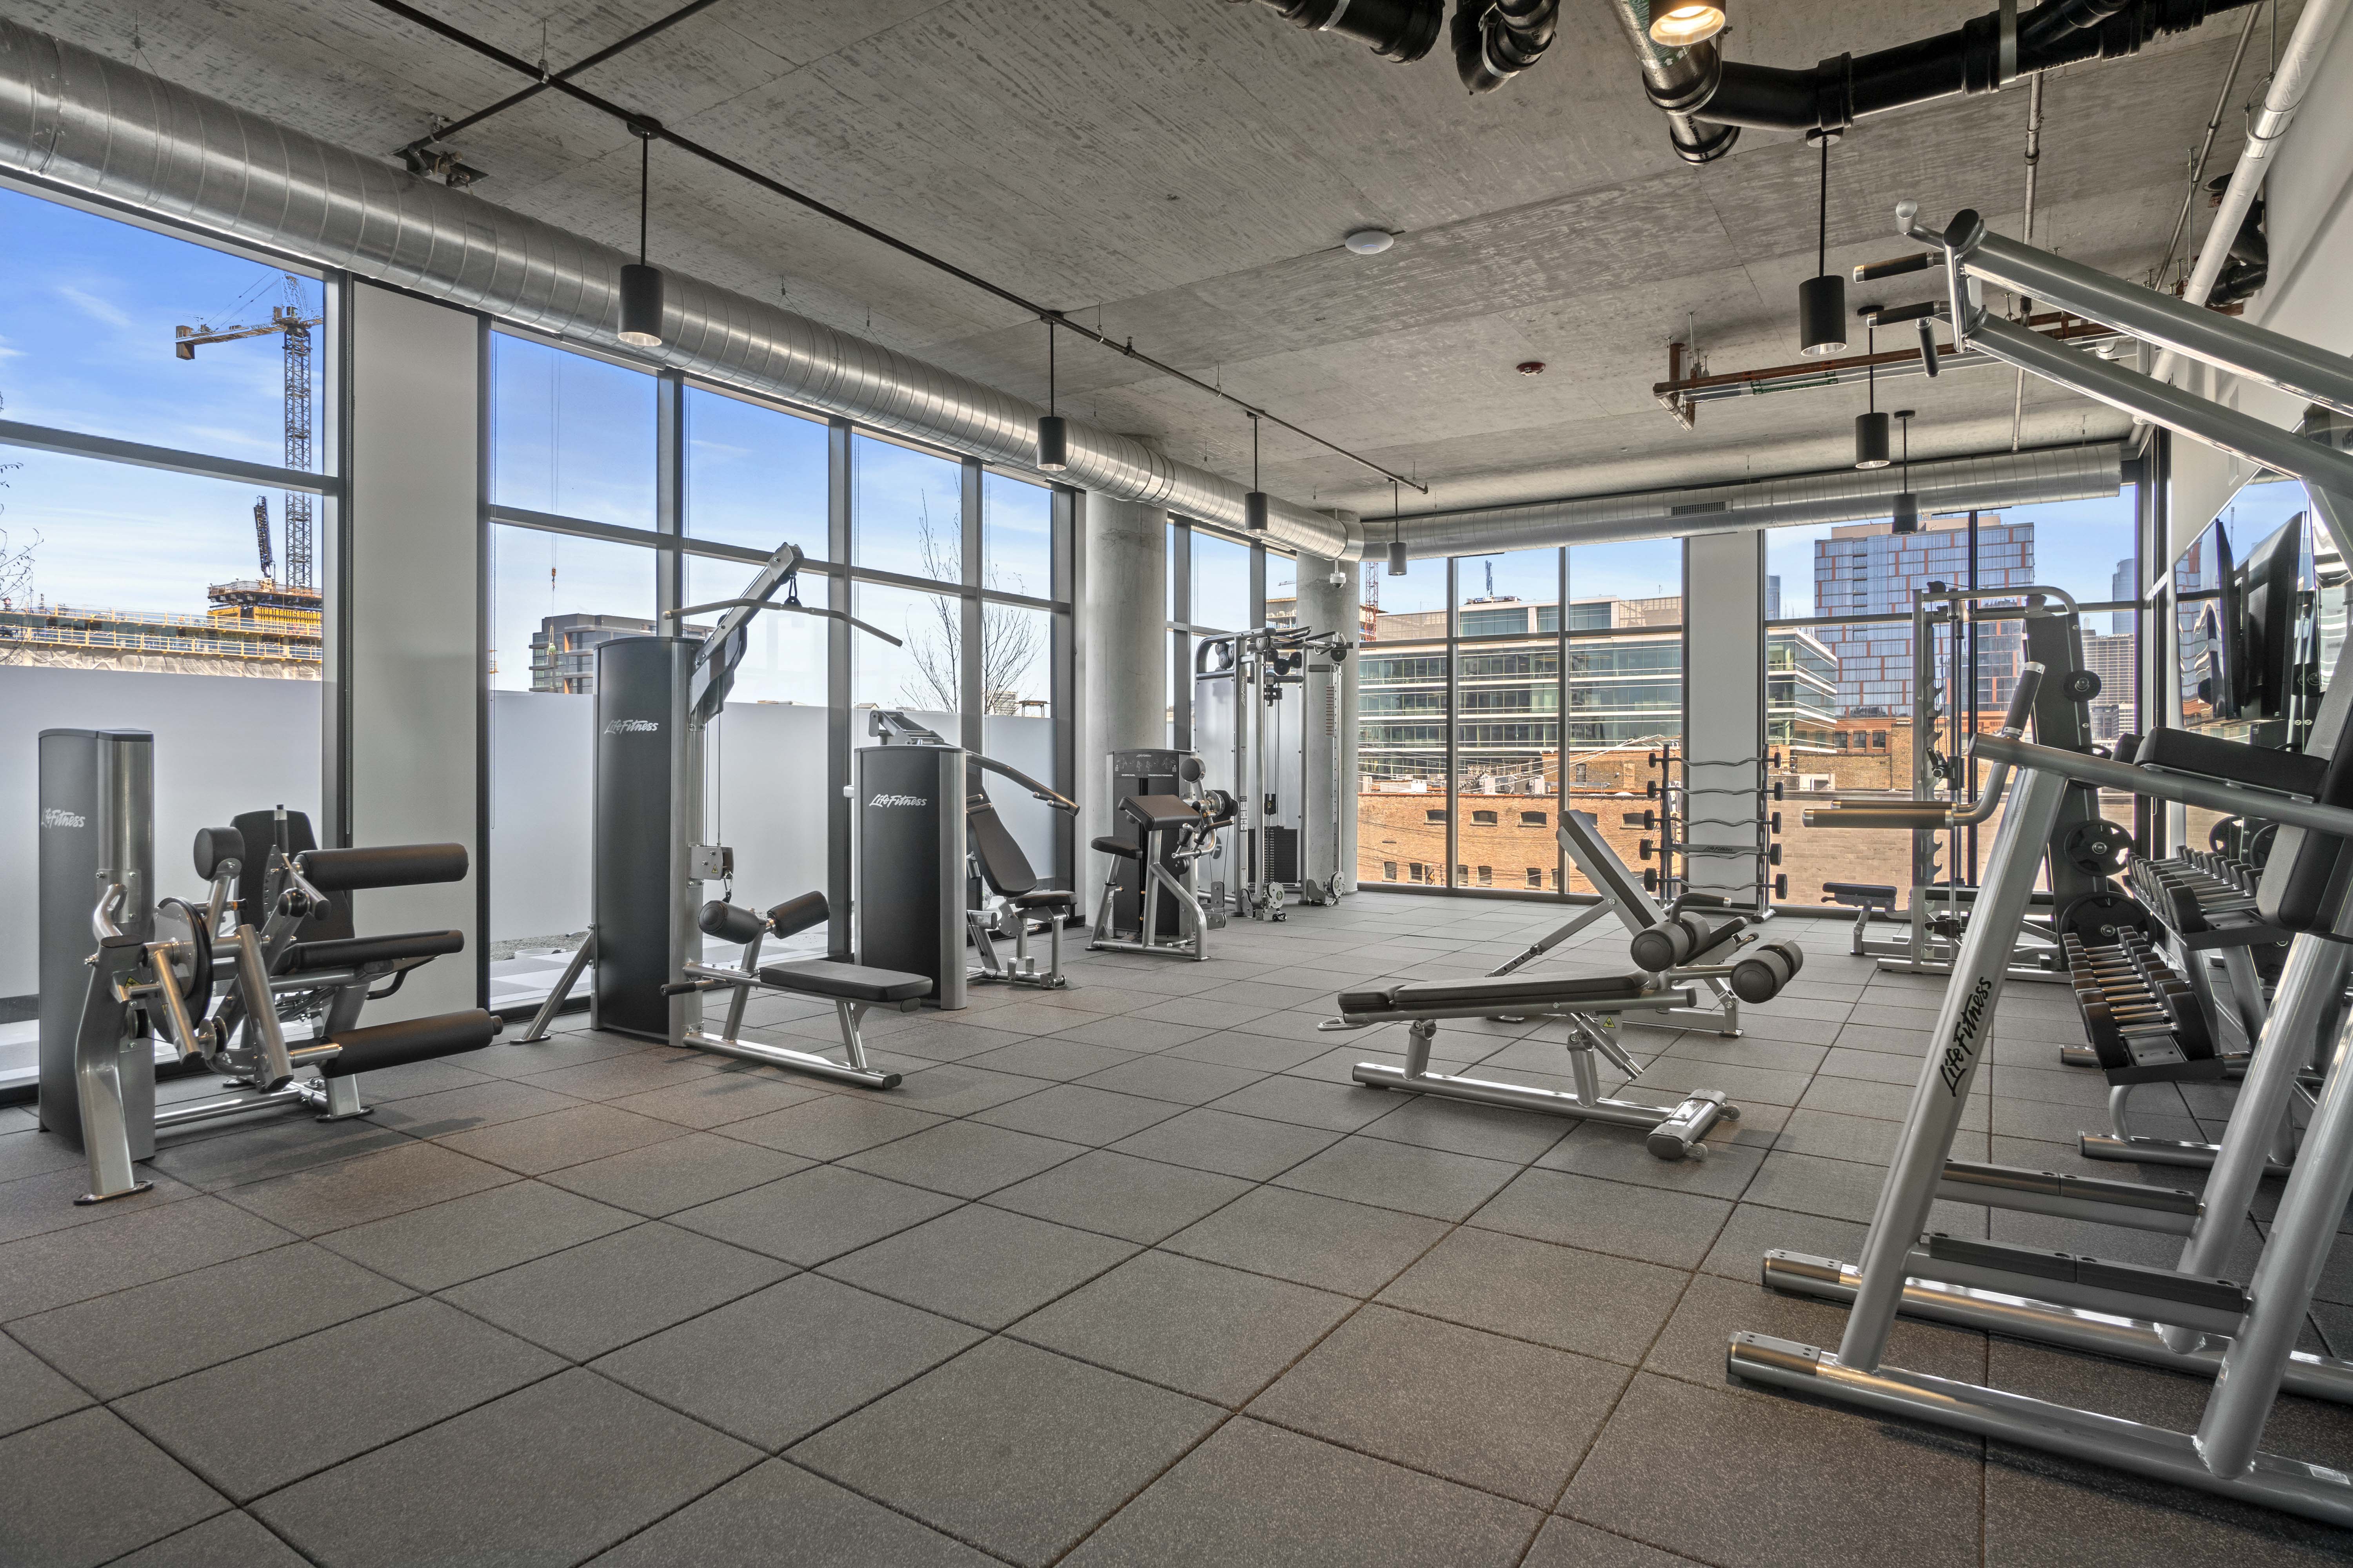
| Fitness center | Yes | Yes |
| Rooftop | Yes | Not listed |
| Doorman or concierge | Yes | Yes |
| Parking | Not listed | Not listed |
| Pets allowed | Yes | Not listed |
| EV charging | Not listed | Not listed |
| Balconies | Yes | Yes |
| Amenities listed | 29 | 23 |
| Managed by | Greyshore Management | Waterton |
Getting around
| Fulbrix | The Mason | |
|---|---|---|
| Nearest CTA | Morgan (Green, Pink), 9 min walk | Ashland (Green/Pink) (Green, Pink), 7 min walk |
| Nearest grocery | West Loop Market, 4 min walk | Marathon, 4 min walk |
| Transit to O'Hare | 68 min | 65 min |
| Transit to Aon Center | 32 min | 31 min |
| Transit to Willis Tower | 27 min | 27 min |
| Transit to Art Institute | 28 min | 28 min |
| Transit to Union Station | 24 min | 24 min |
| Transit to Millennium Park | 28 min | 28 min |
Walk times are sidewalk-routed. Transit times are for a weekday morning. See how we measure.
Frequently asked
Is Fulbrix or The Mason cheaper?
Fulbrix starts lower, at $2,529 a month against $2,611 at The Mason. For a studio, the median asking rent is $2,534 at Fulbrix and $2,611 at The Mason, a difference of $77 (3%). For a 1 bedroom, the median asking rent is $3,066 at The Mason and $3,136 at Fulbrix, a difference of $70 (2%). For a 2 bedroom, the median asking rent is $4,439 at The Mason and $4,922 at Fulbrix, a difference of $483 (10%). For a 3 bedroom, the median asking rent is $5,575 at The Mason and $5,732 at Fulbrix, a difference of $157 (3%).
Which has more apartments available, Fulbrix or The Mason?
As of September 23, 2026, Fulbrix has 49 available apartments and The Mason has 25 available apartments.
Which is rated higher on Google, Fulbrix or The Mason?
Fulbrix is rated 4.5 out of 5 from 66 reviews. The Mason is rated 4.7 out of 5 from 196 reviews.
Where do these numbers come from?
Precise Rent reads each building's own published pricing and availability every morning and afternoon. Rent is the listed monthly price before any special, for apartments available right now. Google ratings are as published on Google Maps.